
Using Message Trace to Troubleshoot Workflows
Message Trace is a powerful visual feature that facilitates quick diagnosis of the cause of a workflow failure.
Sources for workflow failures include business exceptions and edge cases. The specifics of business exceptions will vary between connectors, however, in general the process below may be used to identify the information provided by a connector.
Step 1: Identify Failures
Workflow failures may be the result of business exceptions, data issues, or connection issues, among other causes. Before a failure can be triaged, however, an admin user must first know that a failure has occurred. This can be done in several ways:
-
Automatically receive Email Notifications when an error occurs. Email notifications can be configured on a workflow’s settings page. See Enabling Notifications for Workflow Failures for a walkthrough of setting up failure notifications.
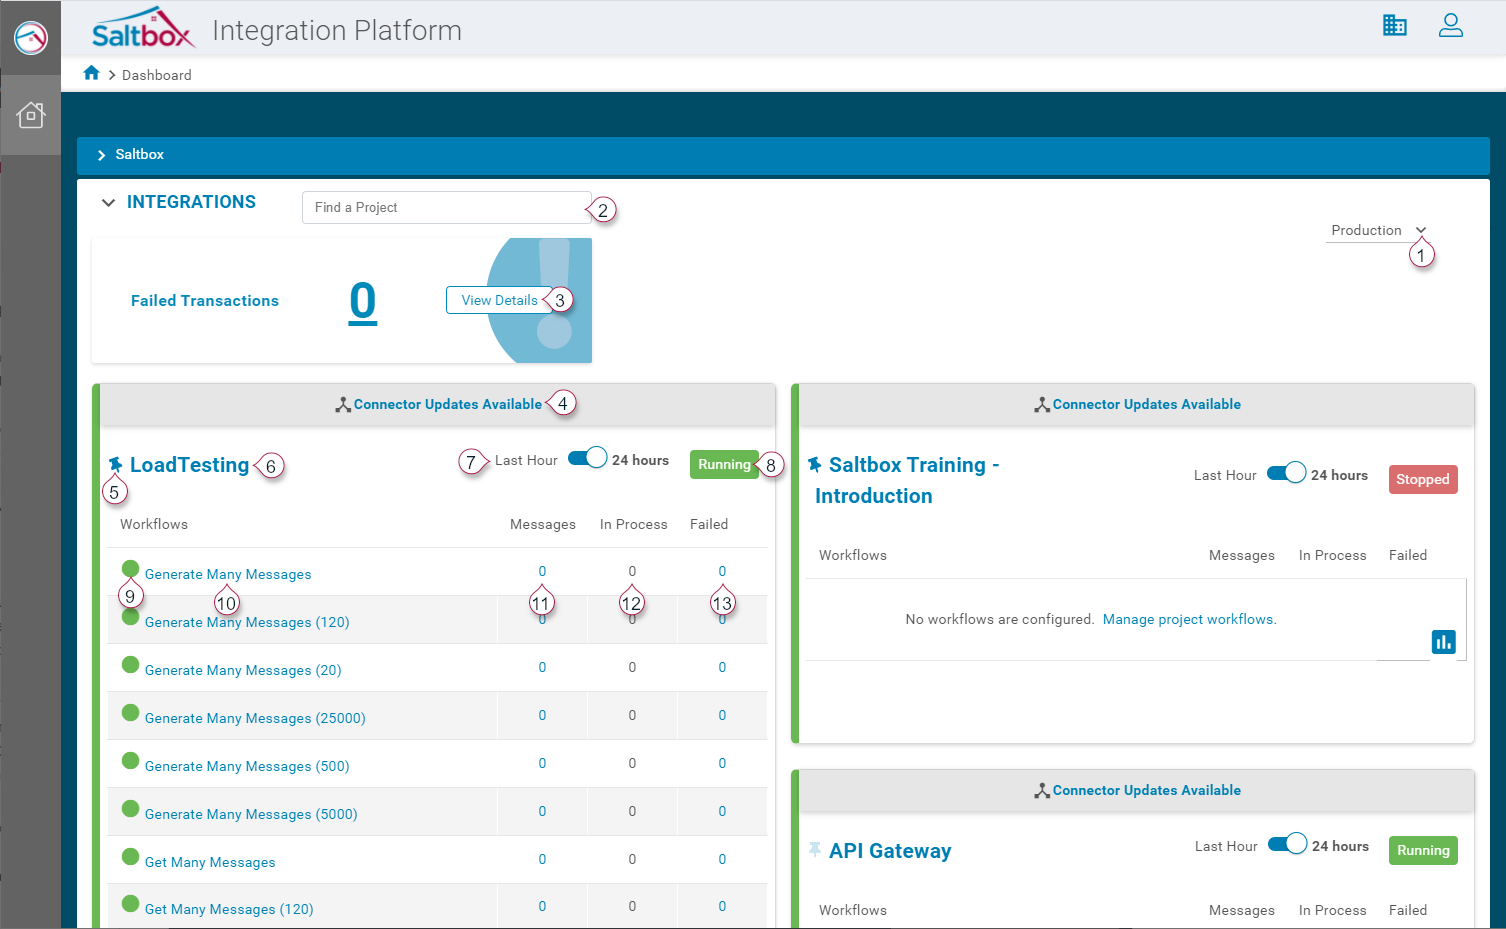
- Manually review the Dashboard on the Saltbox landing page.
- Pick the desired environment: Production, Staging, UAT or Development (marker 1 below).
- View a list of all failed workflows in the selected environment using the Failed Transactions widget (marker 3 below). This will open the tenant-level Messages page filtered to view recent failures.
- View individual project dashboards and filter messages run in the past hour or past 24-hours (marker 7 below). Use the failure count link (marker 13 below) to open the workflow-level Messages page filtered to view recent failures.
- Manually apply message filters to the Messages page. This page displays the most recent messages by default, and can be filtered to focus on failures. Three versions of the Messages page can be explored:
- Tenant-level messages - accessible from the dashboard page. This will display all messages for all projects in the selected environment.
- Project-level messages - within a project, go to the Projects menu > Messages. This will display all messages for the selected project’s workflows.
- Workflow-level messages - within a workflow, go to the Messages page. This will display messages related to the current workflow only.
- Manually Test with Workflow Designer using the Run button. In this case, failed messages will be temporarily accessible from Workflow Designer. Afterward, the outline below may be used to re-open these messages. For a video walkthrough of this process, see Realtime Workflow Testing.
Step 2: Open Message Trace
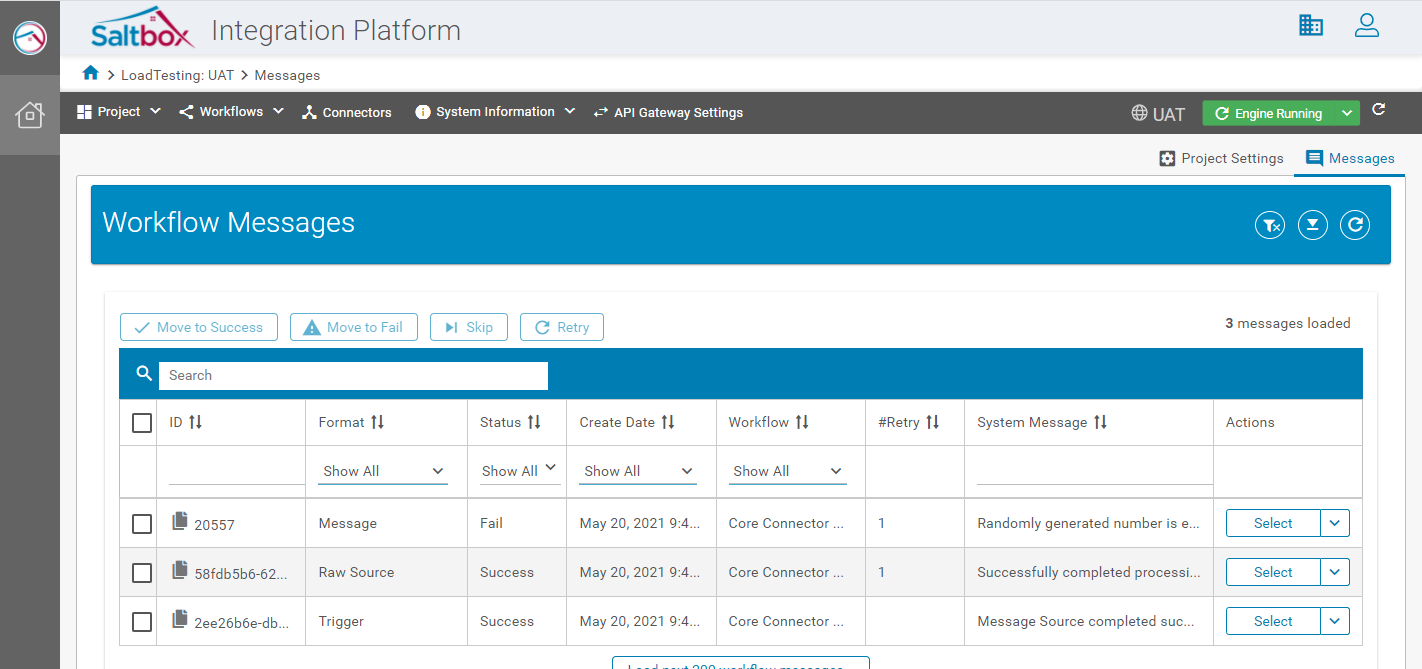
Message Trace allows a message to be traced through the workflow, action-by-action. To view a Message Trace, first access the Messages page for the workflow. The Messages page is where workflow messages can be viewed for troubleshooting. This page shows all message types (successes and failures) but for the purposes of troubleshooting, failures are the most useful.
To open a failed message for troubleshooting:
-
Open the Messages page (tenant messages can be opened from the dashboard, project messages can be opened from the projects menu, or workflow messages can be opened from within a workflow).
-
Apply the appropriate message filters.
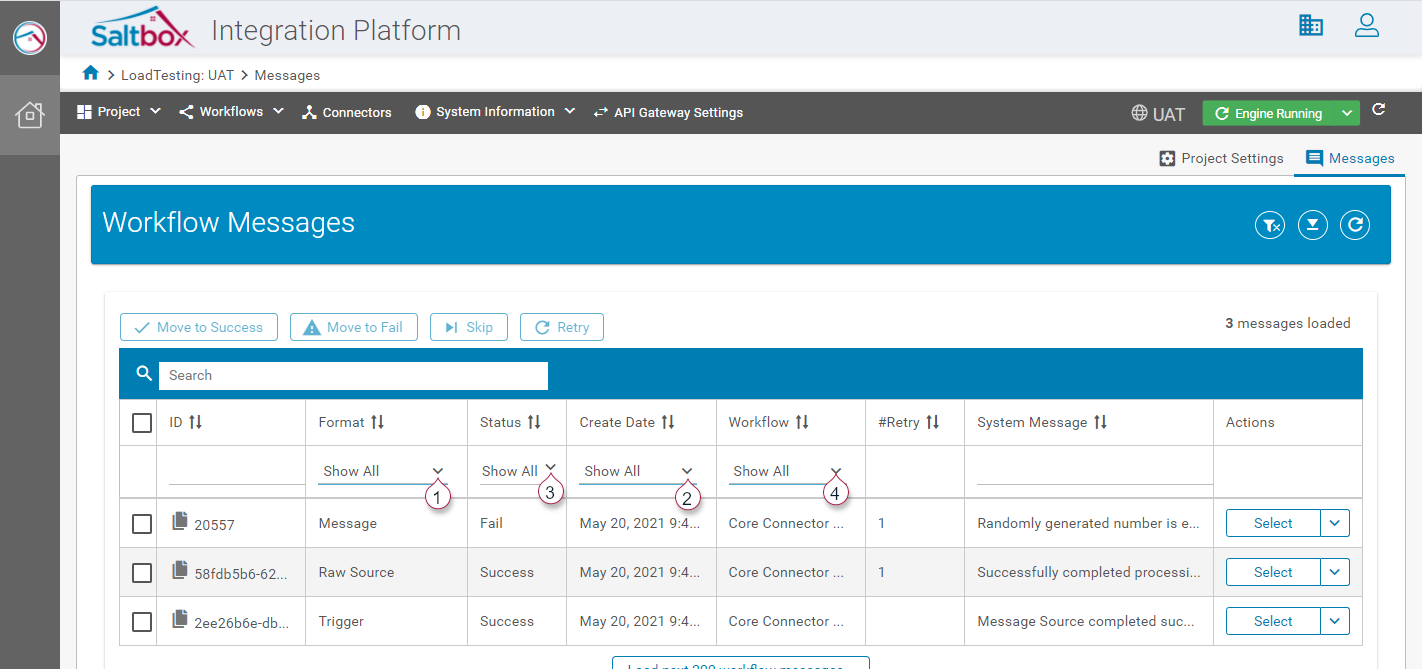
-
Format (marker 1 below), status (marker 2 below), target date/time (marker 3 below) can be used to filter for desired messages. On the tenant-level and project-level messages pages, further project/workflow filters may be applied (marker 4).
-
-
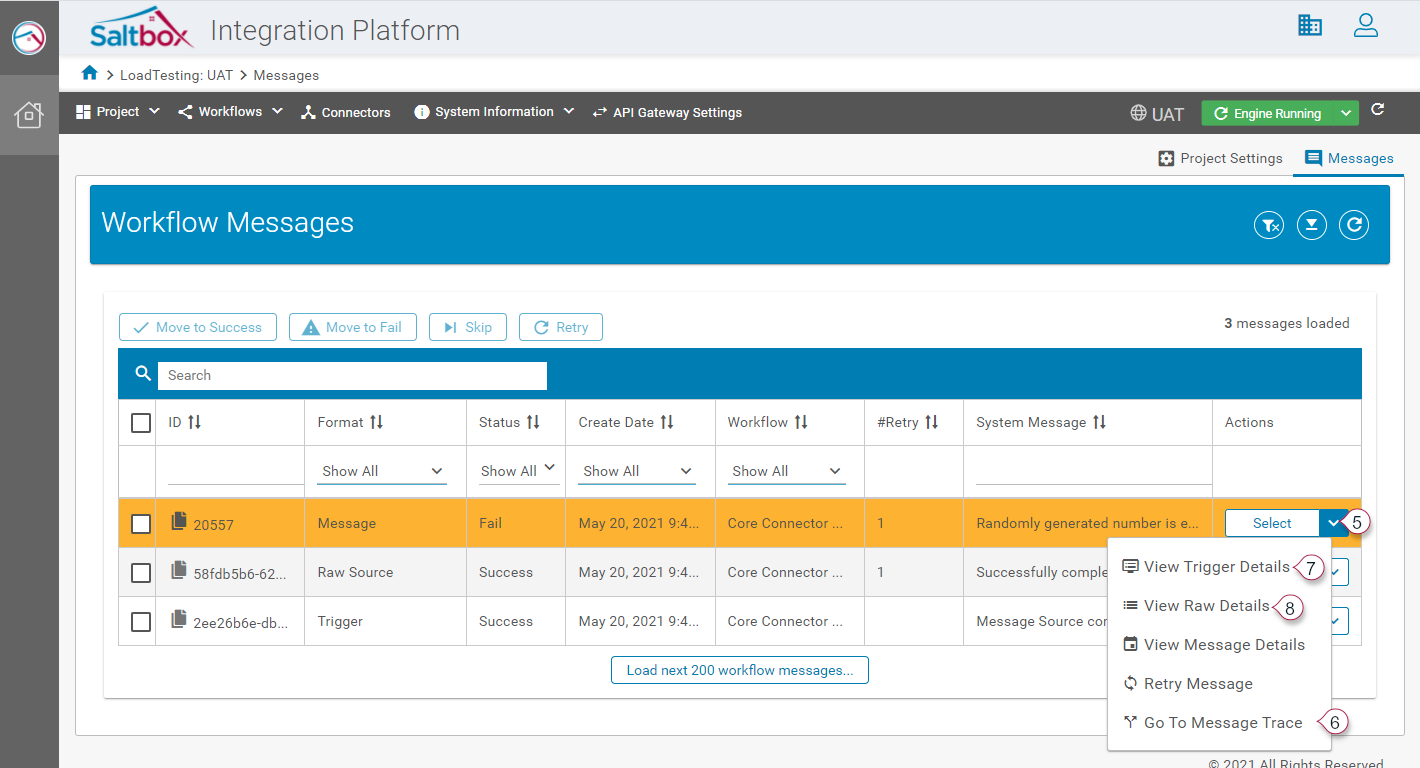
Once the desired message is loaded, open the Actions pane on the right, and open Message Trace (markers 5, 6 below). Note that Triggers and Raw Source messages can’t be traced but can be inspected for logged errors using the “View Trigger Details” and “View Raw Details” options (markers 7, 8 below).
Step 3: Trace the Message
Once a Message Trace has been opened, it can be used to troubleshoot a failed message, or view the details of a successfully processed message.
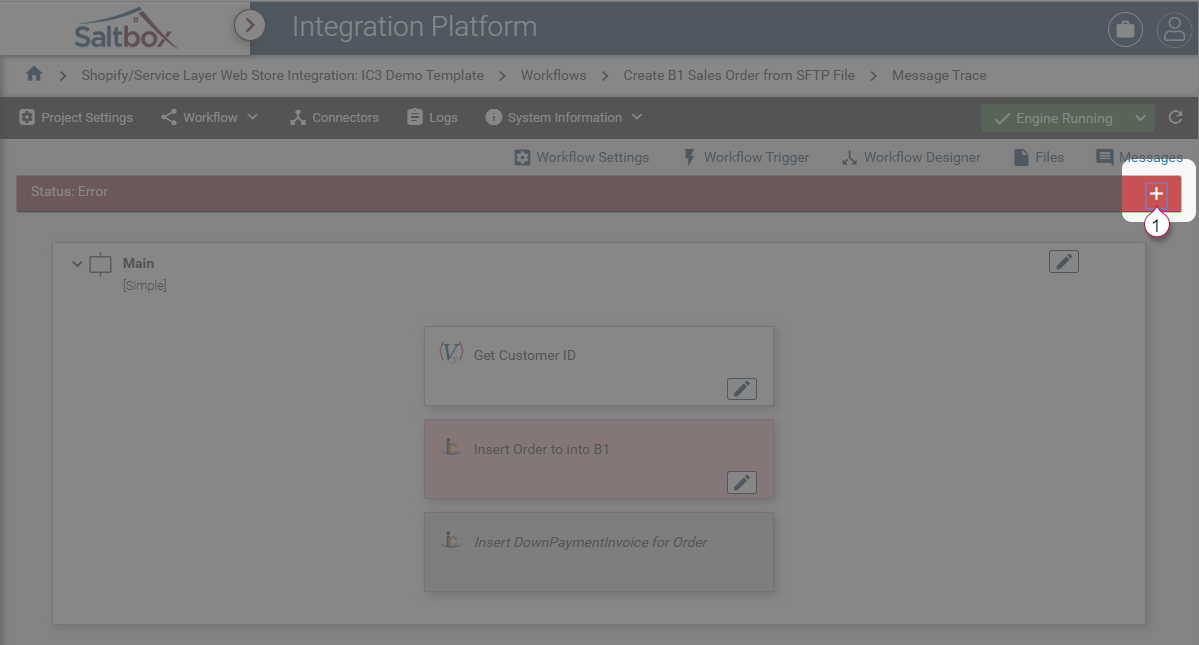
Step 3.1: View Trace Summary
Basic details of the Message Trace are summarized at the top of the page. Expand this section to view details including how long the workflow took to process the message, status of the workflow execution, and the point of failure (if applicable). The raw file and the resultant message xml converted from that raw file can be downloaded. These can be saved as file samples for future use, or reviewed.
Expand the summary (marker 1 below) to view details.
Examples of success and failed Message Trace details are below:
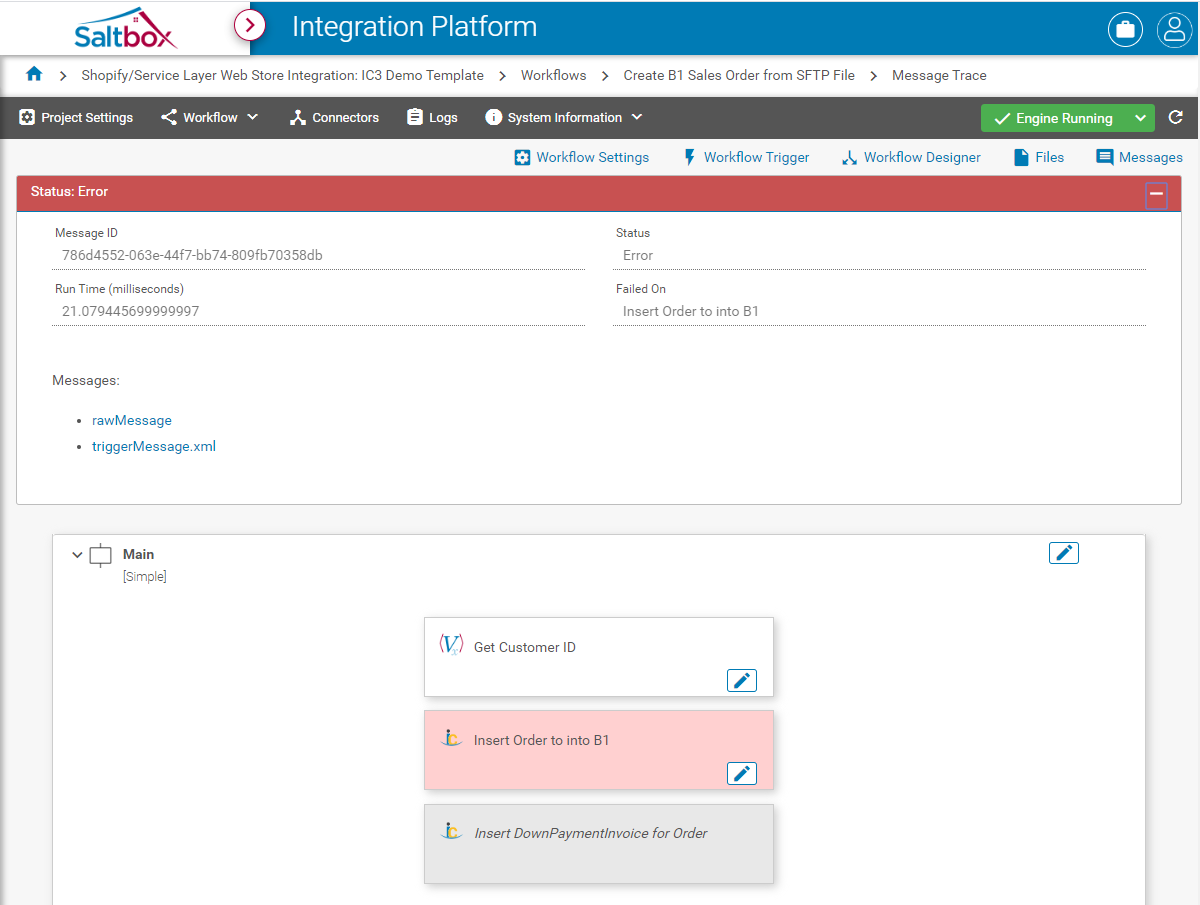
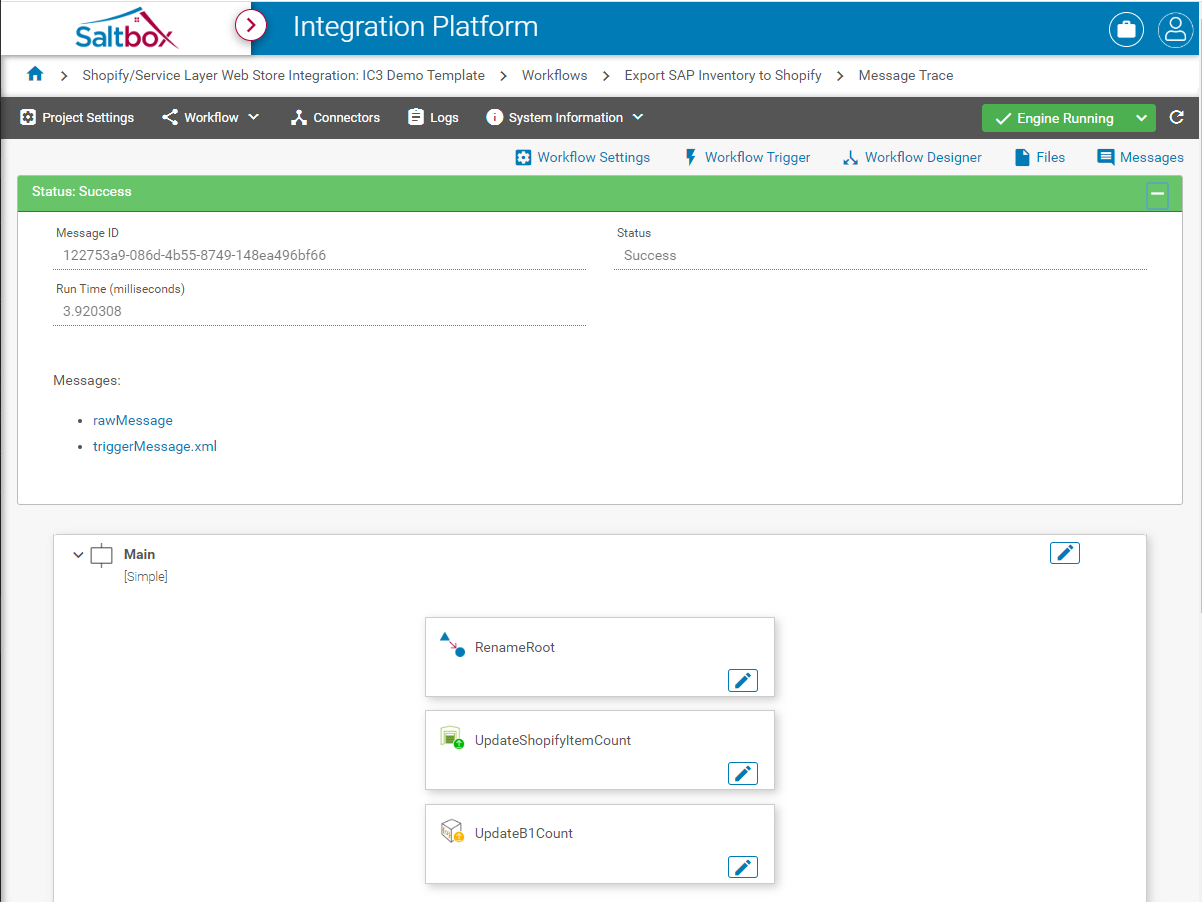
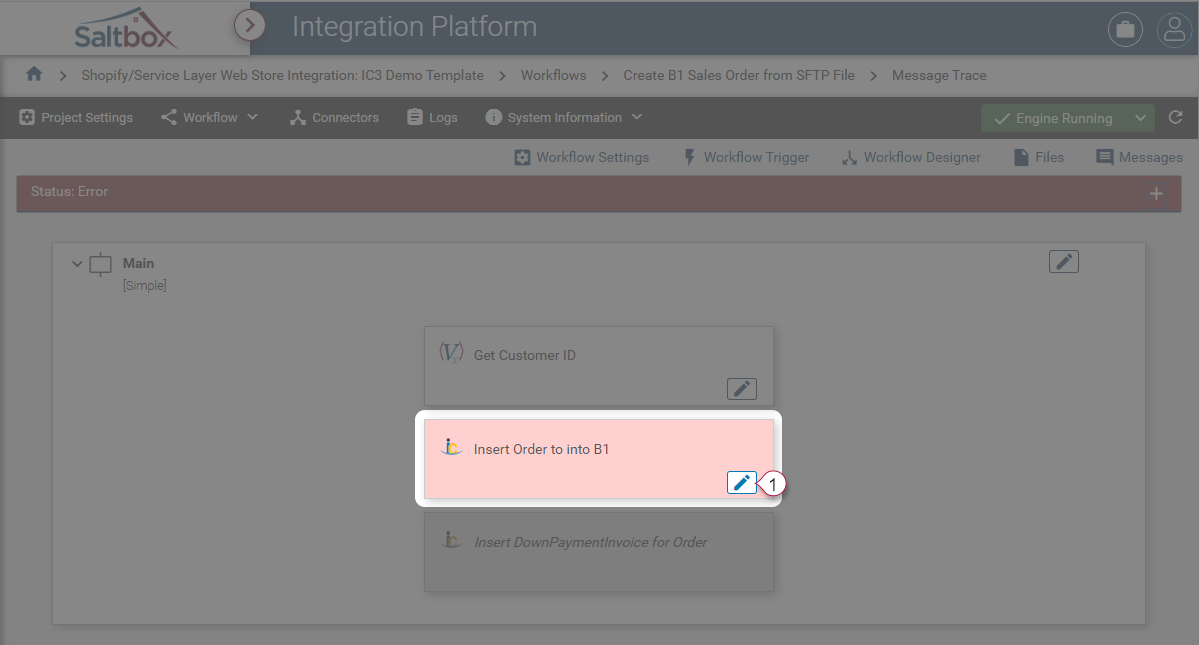
Step 3.2: Follow Execution Path
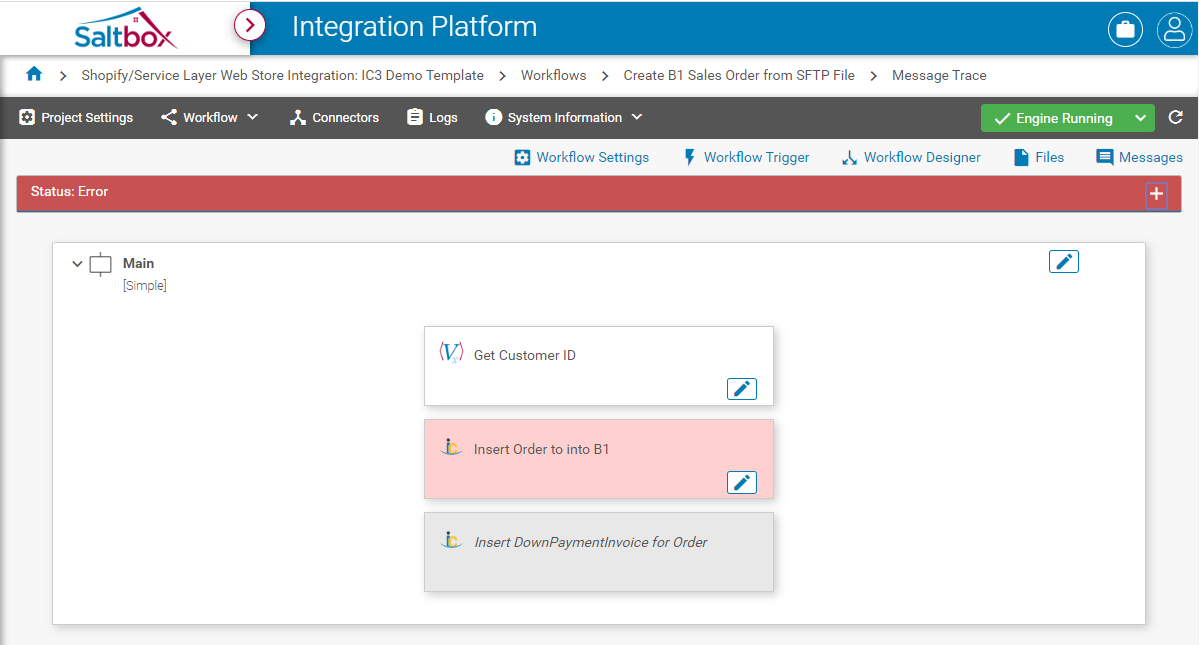
Message Trace shows the execution path of the message through the workflow, with each action highlighted.
Actions highlighted in white show actions which were executed.
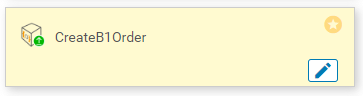
Actions highlighted in yellow show actions which were executed, and which are retry save points. In the event that the workflow is retried, it will start from the latest retry save point.
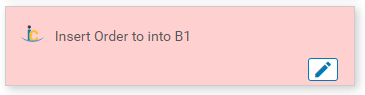
Actions highlighted in red show actions which failed to execute, but which were attempted.
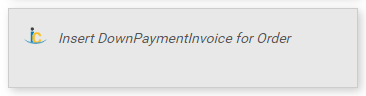
Actions highlighted in trey show actions which were not run, such as branches that were skipped, or actions past the point of workflow failure.
In the following example
- The first action was executed successfully.
- The second action resulted in workflow failure.
- The third step was not executed due to the failure on the second action.
Step 3.3: View Action Details and Logs
When a workflow fails, the failing action is identified, and log details are available for troubleshooting.
To view details of a failed action:
-
Inspect failing action details using the pencil icon (marker 1 below).
-
Scroll down to the log section to see what caused the action to fail.
-
View or download input and output messages for the action.
Walkthroughs
Failure in workflow “Shopify Order to SAP Business One Sales Order”
-
From the Integrations Dashboard, open the Messages page with Failure filter enabled.
-
Hover over the System Message section to preview the cause of the message failure.
-
Using the failing message’s action menu, open the Message Trace.
-
Scroll down to the failed action, and open the details using the pencil icon.
-
Download the input message provided to the action. This can be used to troubleshoot data issues.
-
Inspect the log details to view the cause of the failure.